


What Drives Our Long-Term Budget Deficit?
Unpacking the Real Sources of America’s Fiscal Imbalance


The Congressional Budget Office (CBO) just released its annual update to the long-term budget projections for the coming 30 years. The budget deficit is forecasted to increase significantly, reaching 7.3 percent of GDP in 2055. Meanwhile, debt held by the public is projected to reach its highest level ever in 2029 and then continue to grow to 156 percent by 2055.
In other words, our fiscal condition is already dire, and it is going to get significantly worse in the coming years and decades. This begs the question, “How did we get here?” While the answer to this might seem obvious to some, many economists and policymakers alike make faulty claims about the drivers of our current and future structural deficit.
Take, for example, a report by the Center for American Progress, which boldly claims that “the Bush and Trump tax cuts—are responsible for more than 90 percent of the change in the trajectory of the debt ratio to date.” Similarly, policymakers such as Alexandria Ocasio-Cortez have said: “I think the largest contributor to the debt ceiling, or to our deficit, has been the Trump tax cuts.”
Let’s start by looking at our current (FY2025) budget deficit. The CBO currently projects that this year federal outlays will total 23.3 percent of GDP, while revenues will come in at 17.1 percent. This compares to historical averages (1962–2024) of 20.5 percent and 17.3 percent respectively.
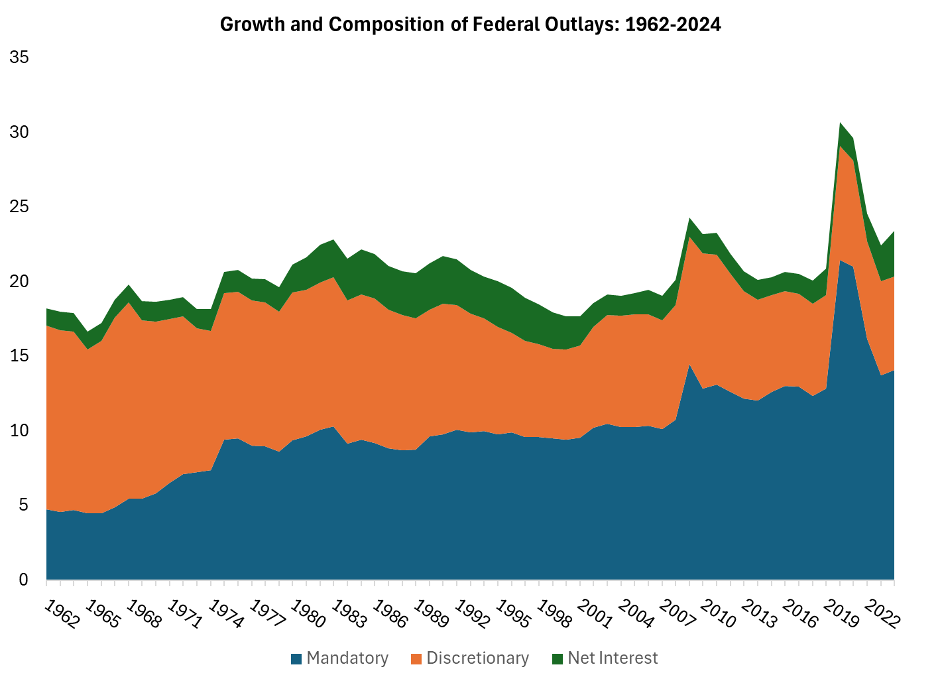
Since spending is significantly above historical averages, it’s worth taking a closer look at how federal outlays have trended over time. Figure 1 below shows the growth and composition of federal outlays over time—we can see that while discretionary spending as a share of GDP has been in decline, it has been outpaced by significant growth in mandatory spending. Mandatory spending as a share of the economy almost doubled in the decade after 1965 with the launch of the Great Society and has been on an upward trajectory since 2007.
Looking at budgetary data over time, we can see that both outlays and revenues have fluctuated as a share of GDP. Figure 2 below plots this data and historical averages, so we can start to see whether our current budget shortfall is rooted in too few tax revenues or too much spending. Here I adopt the methodology of Charles Blahous from his prior budgetary analysis. By plotting the midpoint between historic revenues and outlays, we establish a neutral budget balance point. If one assumes that an equal share of revenue increases combined with an equal share of spending reductions is needed to close the deficit, then the neutral budget balance point is 18.9 percent of GDP based on historical trends.
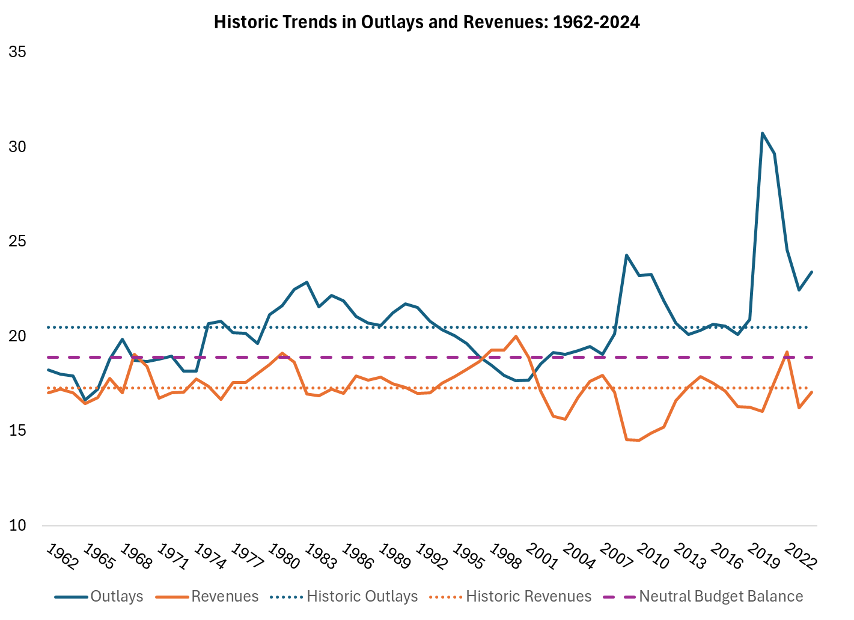
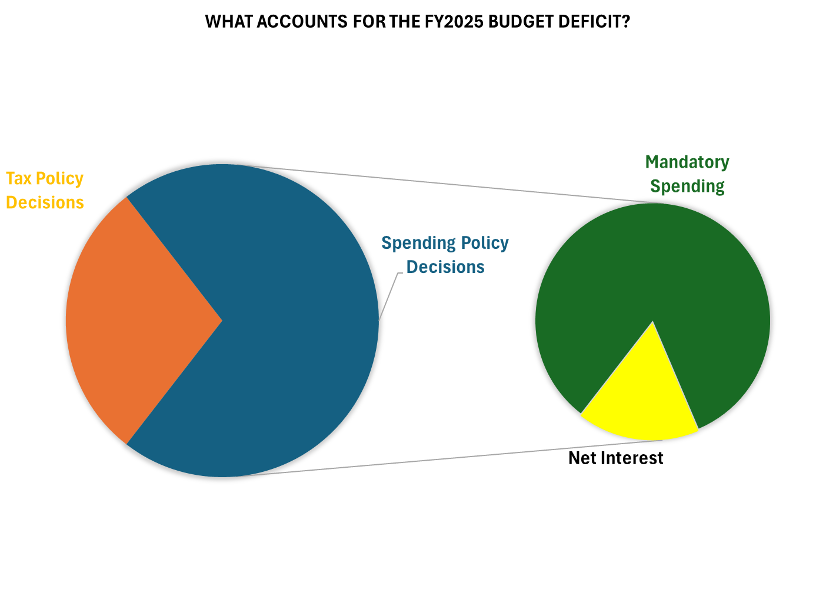
Given that current federal outlays are 4.4 percent above the neutral budget point and current revenues are 1.8 percent below the neutral budget point, we can attribute 71 percent of the FY2025 deficit to spending policy decisions and 29 percent to tax policy decisions. Figure 3 below breaks this out further by showing that most of this spending growth is rooted in mandatory spending, with the remainder in higher net interest spending.
It seems that our current deficit problem is primarily rooted in spending growth (primarily mandatory spending growth), while a shortfall in tax revenues has played a smaller, but still notable role in driving our current deficit. These findings sharply contrast with the claims of policy groups and lawmakers who claim that more than 90 percent of our fiscal gap is driven by tax policy.
Next, we can use the same method to measure whether spending or tax policy decisions contribute to the nation’s future fiscal imbalance. With the recent release of the CBO’s long-term projections, we can use 2050 as a proxy for the government’s long-term structural fiscal gap.
Under current CBO projections, federal outlays will reach 25.9 percent of GDP in 2050, far higher than historical averages, while federal revenues will reach 19.1 percent, also higher than historical averages. Figure 4 below shows the contributing factors behind the government’s long-term fiscal gap.
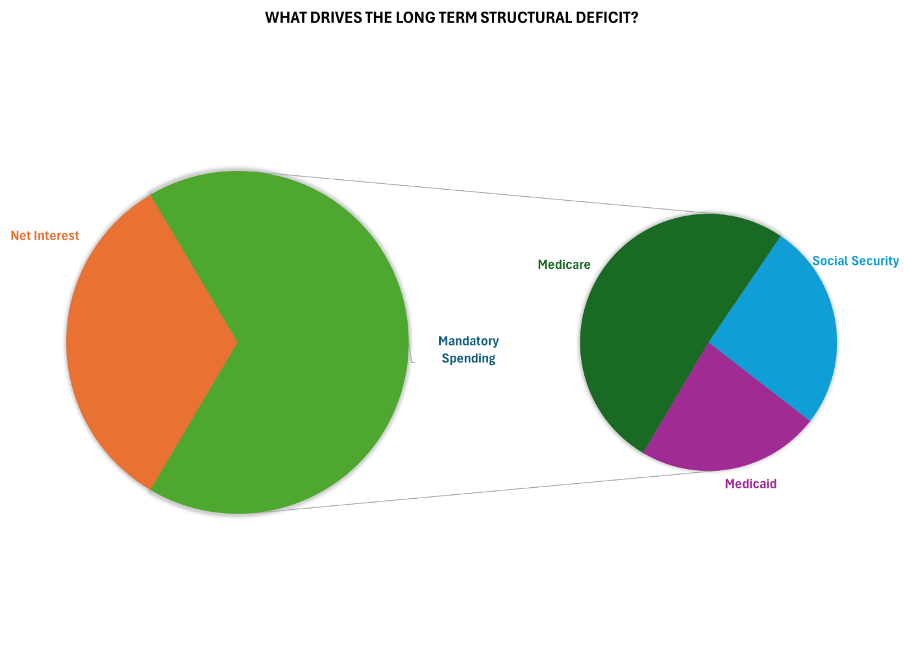
As federal revenues are forecasted to be higher than the point of neutral budget balance by 2050, the entirety of the long-term structural deficit can be attributed to spending policy decisions. Specifically, 67 percent of the long-term structural deficit is attributed to growth in mandatory spending programs, while the remaining 33 percent is attributed to growth in interest payments on the debt. Breaking this down further, the most significant driver of long-term mandatory spending is Medicare.
While revenue shortfalls play a role (albeit smaller) in our current fiscal shortfalls, the nation’s long-term structural deficit is driven by unsustainable growth in mandatory spending programs, not insufficient revenues. The entitlement program that deviates furthest from sustainable levels is Medicare, which will grow to almost 7 percent of GDP by 2050.
While blaming tax cuts for the nation’s skyrocketing debt ratio might be a popular narrative, budget projections and historical data point decisively to the structural growth of mandatory federal obligations, particularly those serving aged populations. Policymakers who are serious about tackling this issue will have to confront the politically difficult, but economically essential, task of slowing the growth of these programs.